There’s no shortage of books, websites and stock tip newsletters and clubs out there, especially online all claiming they can give you superior returns. They all claim they can do better than the market, and of course I’m no different in that regard.
However, where I am different, compared to what I’ve read online, is in the approach I take in evaluating strategies for stock selection and market timing. And this is my first post to help explain my approach to equities investments.
S&P 500 returns
Today, we’ll start with the US market. Every investor not satisfied with a fund wants to beat the market. The S&P 500, the top 500 stocks in the USA by market capitalisation, has returned 51% in the last 5 years. So 1,000 USD invested would have grown into 1,510 USD. This represents a Compounded Annual Growth Rate (CAGR) of 8.6%. As annual returns go, it doesn’t sound terribly exciting for a lot of people yet that’s the power of compounding.
The Rule of 72
In fact, as a quick aside, if you’re ever wondering how long it will take to double your money or what rate you’d require to double in a given time period, use the rule of 72!
Here’s how it works:
You’re earning 9% annual returns every year and want to know how long it will take to double your money, using the rule:
72 / 9 = 8 years
It also works in reverse. You want to double your money in 3 years, what CAGR rate will you require?
72 / 3 years = 24
Which is 24% every year for 3 years
It’s not exact and yet it’s a reasonable rough estimate.
Back to CAGRs
Beating the S&P500 is the ultimate aim of most if not all active investors. I asked over 10 people in passing the minimum return they’d required to invest in a hedge fund and the answer was always 10%.
It doesn’t like much more than the S&P500 market of 8.6% but it’s actually 16% better. So instead of doubling your money in 8 years, it’s doubled a year earlier in 7.
Naturally, there’s very little risk in putting money into the S&P 500 compared to selecting your own stocks as you’re effectively buying ‘America’.
So to my mind, for the risk involved a fund or service like this one should deliver returns of 16% or more. Thus, quite a bit of research is required on my side to make sure that any recommendations made pass a number of tests.
Why I don’t backtest
According to google, backtesting is the general method for seeing how well a trading strategy would have performed in hindsight using historical data.
If backtesting works, then traders will usually have the confidence to employ it going forward.
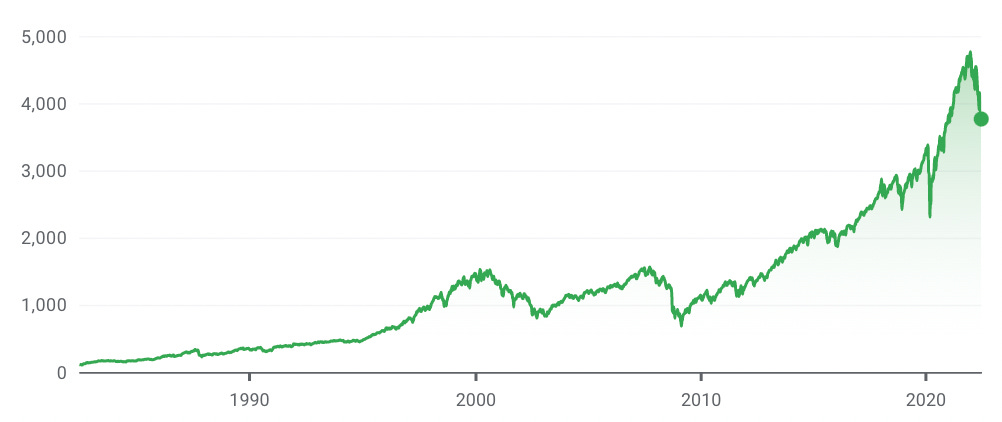
In most scenarios, and despite the sophistication of methods to signal when to buy and sell, it’s very difficult to beat the buy and hold strategy. Most of these are based on the speed of stock prices moving averages and get it mostly horribly wrong!
Take the S&P 500 shown below:

History simply doesn’t repeat itself in the same way, so I prefer to use probability which I’ll explain a bit more later.
The ones that get it right are either lucky, know what they’re doing or both! There is most definitely a place for back testing, I prefer a different approach.
The distribution of returns
Given the reason we are here is to increase our ultimate wealth, my decisions revolve around maximising the average CAGR per year over the long term (over 20 years).
Why? Because it’s more robust, and it means that you don’t care too much about short term fluctuations even if they are a bit annoying!
I also like the idea of knowing the average CAGR so that I can use the rule of 72 to get a quick idea of when my money is likely to be doubled.
As mentioned earlier, I prefer probability. Warren Buffet recently said in his recent 2022 Berkshire Hathaway conference that the stock market has become a gambling parlour. You don’t say Warren!
In my view, it always was to quite a degree. And for that reason, I see the stock market as something of a bit of a dice game cum blackjack table. Our job as investors is to improve our returns by getting a statistical edge. Of course to do that, we’ll need to know what the probabilities are.
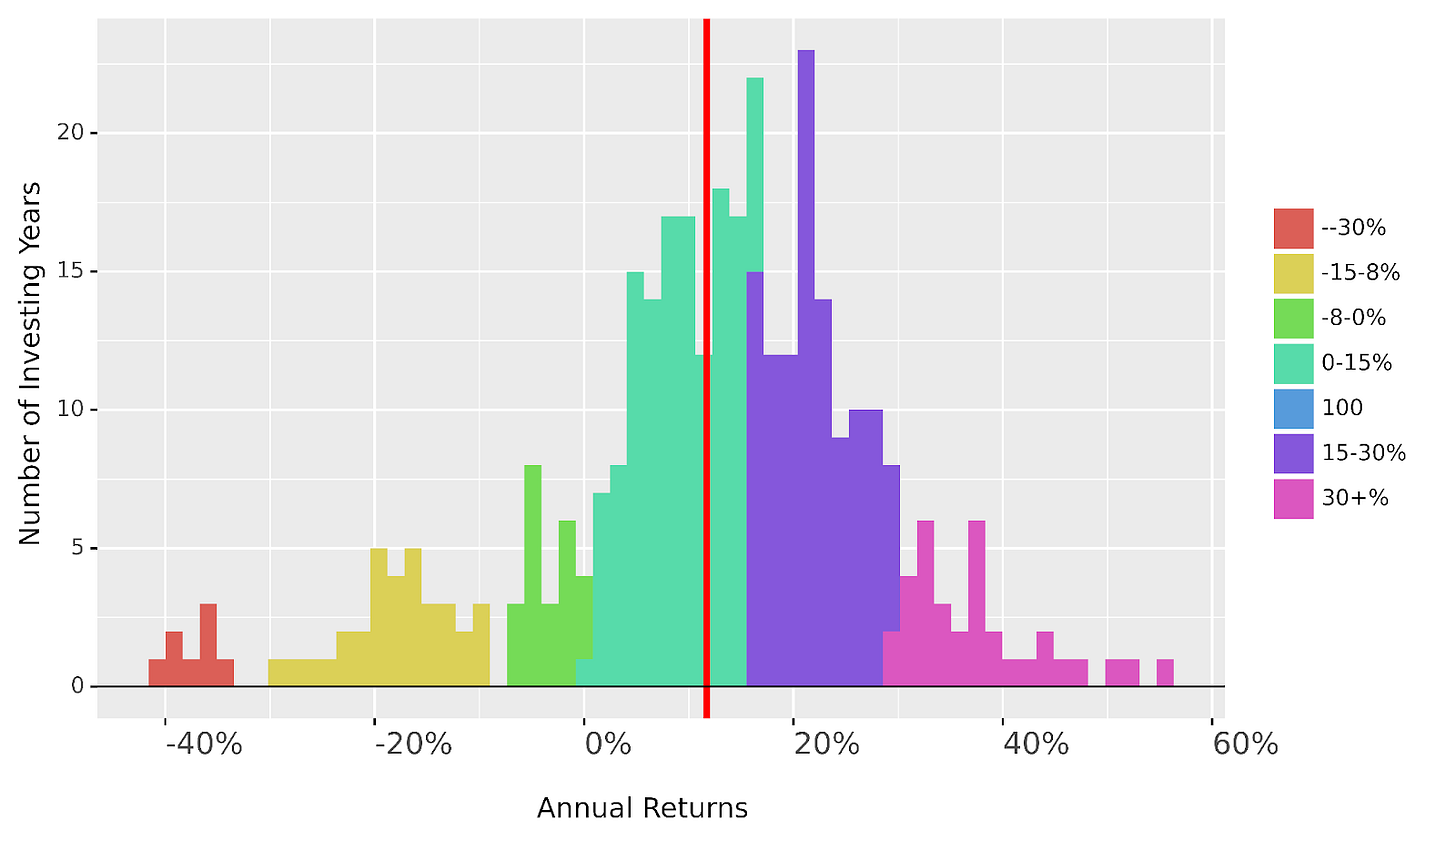
Just as we all know that the chances of rolling a 6 on a die are 1 in 6, we need to know the probabilities for getting returns on stocks are. By way of example, I’ve plotted a distribution of returns for the S&P 500 based on it’s all time history below.

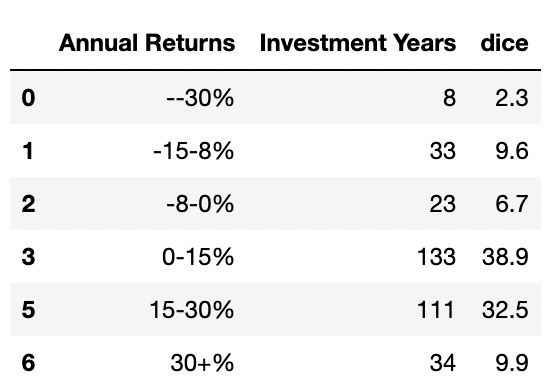
So if we imagine the stock market as a dice game where you buy a stock, only this die is not 1 in 6 to score an annual return of 30+ percent but 10% probability (1 in 10 chance). Most of the return is in the 0 to 15% range as supported by the average (the red line) of a 12% annual return. Let’s look at the full data table:

As you can see, to date investing in the S&P 500 means your chances of getting above zero returns are pretty good – 50% in fact! So if I invested £100, after 1 year we could expect £112 which is 12% on average. This method of evaluation is known as the expected value and assumes you’d be able to access all 6 annual returns in a year and then take the aggregate.
I’m afraid that isn’t quite the reality as you only get one dice throw!! That is assuming you start with the £100 invested but this time you roll only one die each time, you would actually expect your average annual return to be more like 10.4% which gives you a less impressive £110.
A difference of 1.2% annual return over a year, what gives? Over 1 year the difference seems nothing but it’s still an underrepresentation of reality and over a 20 year period is worth an extra 27%!
Multiverse Testing
Of course, that’s the dice roll in this life, but we don’t know which life we’re in do we? To be less cryptic, for this dice roll we don’t know what the annual returns are likely to be over the next few years, let alone (and most importantly) in what order.
But what if we could simulate the market (i.e. different orders) for different versions of us living in different multiverses? I haven’t managed to find a way to reach the other Tysons living in other multiverses, but I do know maths.
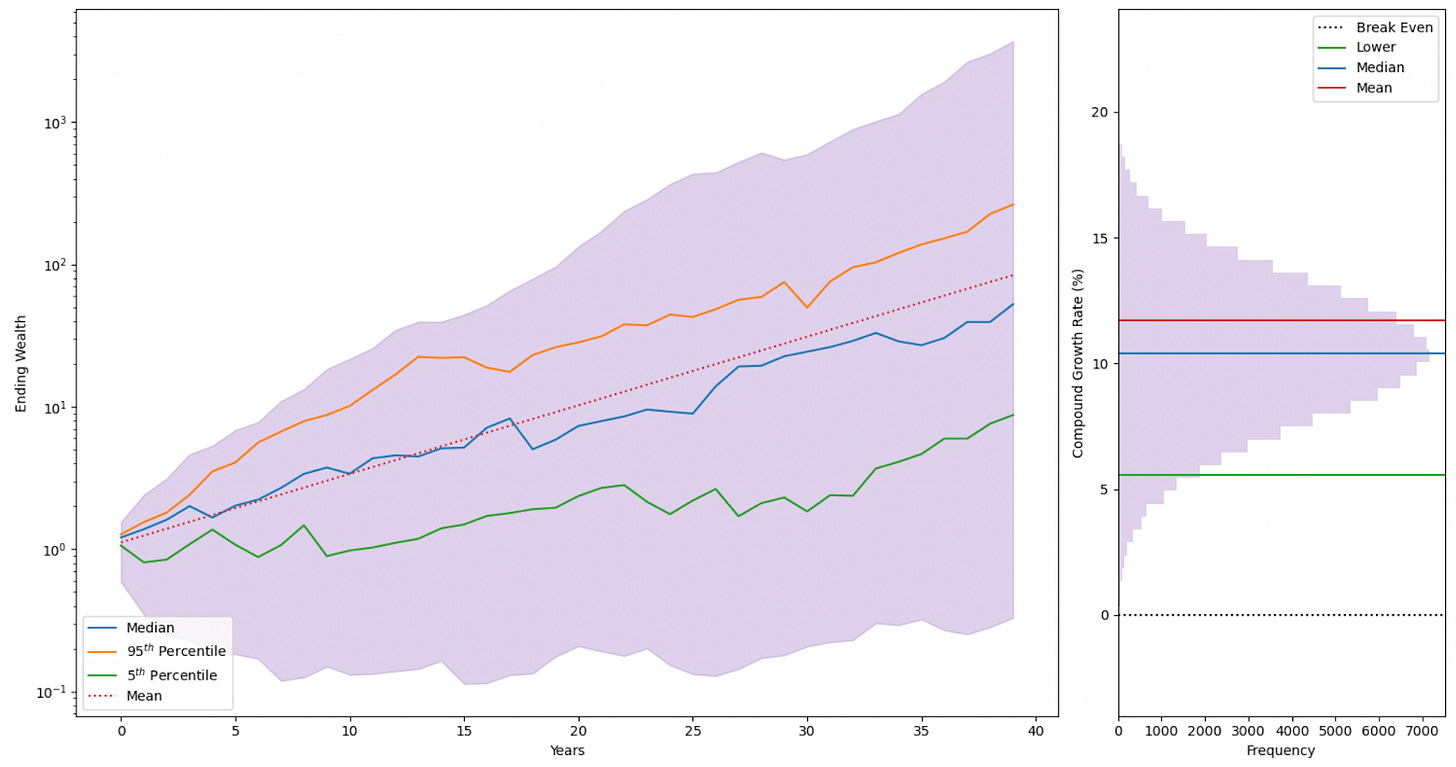
Let us simulate 100,000 multiverses where we have 100,000 Tysons investing the same single sum in the same stock and letting it run for the next 40 years (that’s 40 dice rolls per Tyson) – what is our expected annual return then?

So it seems like 50,000 Tysons out of 100,000 could actually expect a 10.4% annual return and is more representative of reality. If you’re unlucky (like the 5,000 Tysons or the lower 5th percentile), then you can expect 5.6% per year which doesn’t bear thinking in this high inflation economic phase.
You can also see how over time that you’re generally above zero annually throughout the 40 years
Using this perspective and the Monte Carlo simulation method helps me to evaluate investment ideas and stocks before putting out a tip. I’m not only interested in the average return, I’m also interested in minimising risk. And so if that means taking an ever so slightly lower median annual return for a much higher return for the 5th percentile, I’ll take it.
My inspiration
I’d love to say this was all my doing but the reality is that not all of these ideas are my own and I’m partly inspired by the book Fortune’s Formula by William Poundstone and A Man For All Markets by Ed Thorp (which is unputdownable – you’ve been warned!). I will be using Monte Carlo to test famous investment hypotheses put out by the gurus, so as ever – watch this space!
With fun and profit,
Tyson


